
Home
Parseable is an open source, column-oriented data lake built for observability. It brings logs, metrics, traces, and agent telemetry into one system, with SQL and PromQL queries, dashboards, alerting, APM, and AI workflows on top.
Telemetry does not all behave the same way. Logs can be wide and change shape from event to event; metrics can have millions of label combinations; and traces need both individual span lookup and service-level analysis. Parseable stores these signals on a shared, open data lake foundation while letting each be ingested and queried in the way it needs.
How Parseable works
Parseable treats growing telemetry as a data engineering problem. Data moves through three stages:
- Ingest: The data lake engine accepts events at high volume, stages them locally, and forwards them in batches. Staging helps absorb ingestion spikes while producing efficiently sized objects for storage.
- Store: Events are compressed into columnar Apache Parquet files on object storage. Queries can read only the columns they need, and other Parquet-compatible tools can use the same data.
- Query: A separate query engine runs SQL and PromQL. It caches frequently accessed data on local disk, so hot queries do not need to fetch every file from object storage. Ingestion and query capacity can scale independently.
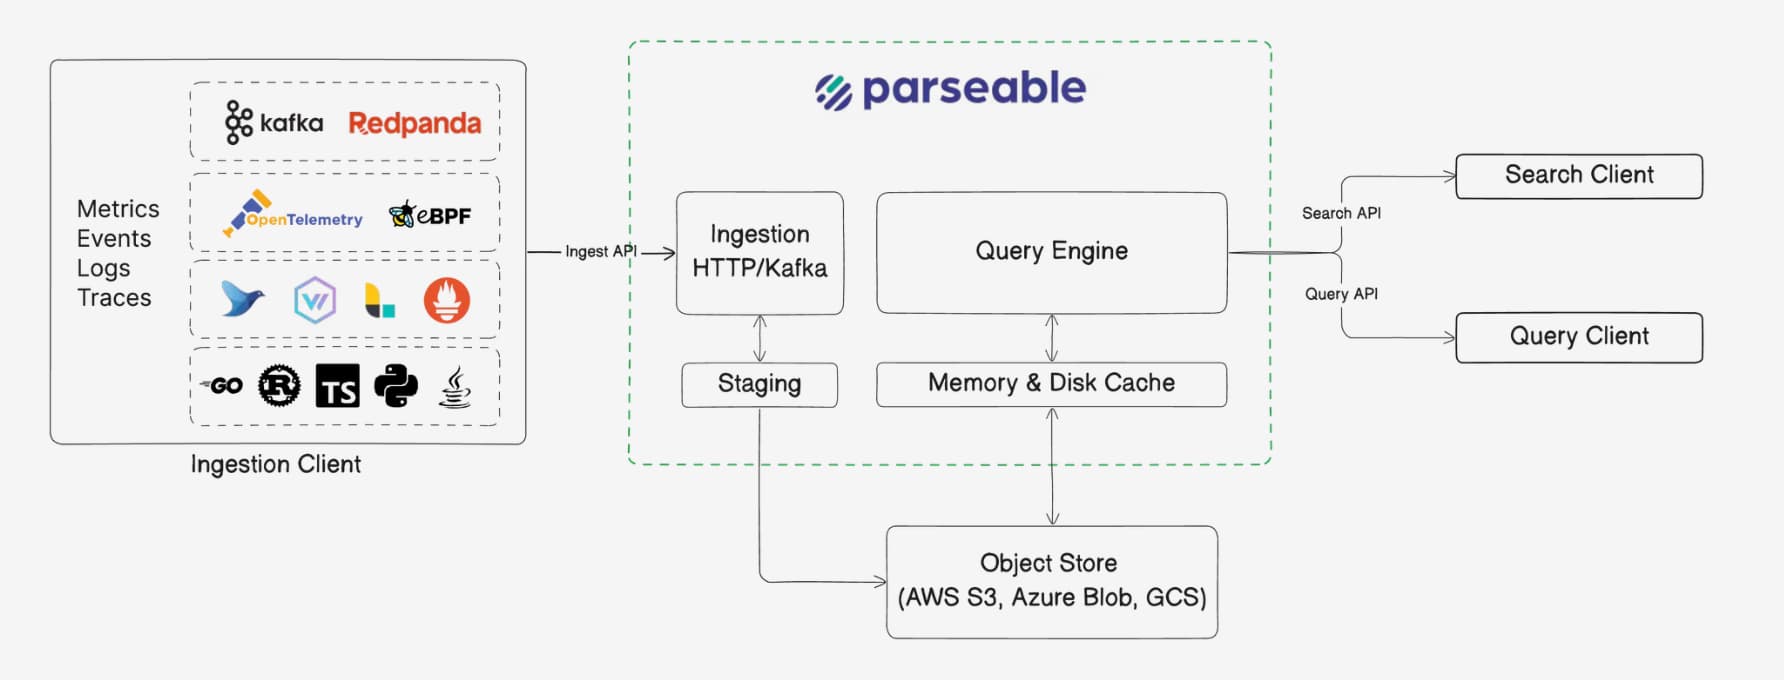
Parseable is written in Rust for predictable performance without garbage collection pauses. Apache Arrow provides an in-memory columnar format for vectorized execution; Parquet is the open format at rest. This design supports wide events, high-cardinality metrics, and growing volumes without keeping every byte on always-hot storage. Read the architecture and key concepts for the deeper model.
You can use the self-hosted core as a single binary, run a managed Cloud workspace, or choose Enterprise for advanced deployments. See the edition comparison for details.
For Windows users
powershell -NoProfile -Command "irm https://logg.ing/install-windows | Out-String | iex"The ingestion overview explains the available protocols. Start with the source you already have:
Collector setup
Send telemetry through the OpenTelemetry Collector.
Fluent Bit
Forward logs from lightweight agents and edge workloads.
Vector
Route, transform, and send logs with Vector.
Docker
Collect logs from Docker containers.
Kubernetes
Send logs and telemetry from Kubernetes clusters.
Prometheus remote write
Ingest Prometheus metrics with remote write.
Programming languages
Send telemetry directly from application code.
AI infrastructure
Observe agents, LLM gateways, runtimes, and coding assistants.
Work with each signal
- Logs: Work with events that range from unstructured text to JSON with changing fields. Parseable can read selected columns from wide or sparse events, while LogIQ can extract fields from verbose log strings. Send OTLP logs, then use the log explorer or SQL editor.
- Metrics: Store numeric time series identified by labels. Parseable stores label values as column data for high-cardinality metrics and provides native PromQL. Send metrics with OpenTelemetry or Prometheus remote write, then explore metrics or query with PromQL.
- Traces: Connect spans by trace ID for specific trace lookup and service-level analysis, including latency and error rates. Parseable supports both patterns on the same columnar data. Send OTLP traces, then use traces or APM.
- Agent telemetry: Bring activity from AI agents and LLM infrastructure into the same observability foundation. Follow the AI infrastructure guides and agent observability to inspect it.
Keep working
- Investigate and share: Build dashboards, set alerts, or connect an integration.
- Deploy and manage: Follow the self-hosted installation guide, then review configuration and access control.
- Use developer tools: Find endpoints in the API reference, or use the MCP server to investigate telemetry with an AI client.
- Find a cause: If data is missing, check the ingestion overview, your source guide above, and API key setup.
Read with an AI agent
Use the full documentation as text, or Copy Markdown on any page. Individual pages also have .mdx text endpoints, such as /docs/pb-cli/install.mdx. For terminal workflows, see pb CLI for agents.
Was this page helpful?